Tuesday, 30 May 2017

Wednesday, 13 April 2016
Friday, 11 March 2016
First Forecast for the New Year: 2016Q1
Well I just got around to updating and doing the forecast for 2016Q1. In terms of the 2015Q4 forecast, I was the most pessimistic of the lot (-.3) and CIBC turned in to be the winner and the exact growth of 0.8%. This quarter I am pleased to say I am the most optimistic of the Banks (along with RBC) at a growth of 2.2% (annualized as always) with Scotia at 1.3%
I incorporated in this forecast the real exports for Jan 2016. As the quarter unfolds and the monthly real GDP are released, it will be interesting to see if this "high" growth continues. Just to put the forecast into perspective the average real growth over the since 1997 has been 2.4%.
In terms of future blogs I want to discuss revised data in general and the that was done last year for the entire series of GDP from 1981
Wednesday, 17 February 2016
Tuesday, 26 January 2016
Why the Focus on Real Growth Rates?
Why the Focus on Real Growth Rates?
We asserted without justification that our goal was to forecast quarter over quarter real growth rates (adjusted to annual rates which is just a unit change). At this point, we turn to the question as to whether this is the most appropriate object or whether other definitions might be preferred.
Why concentrate on growth? There is a lengthy literature on the merits of growth and that countries that fail to grow are doomed. Real growth at a rate higher than population growth usually indicates a rise in the standard of living for the countries’ citizens (exceptions of course if rulers appropriate added income). The argument of growth being important is usually taken as a given and a great deal of government planning revolves around forecasting growth to understand potential tax revenues against planned expenditures.
Productivity growth is usually meant to be labour productivity. Can we produce more goods and services (real GDP) with the same or possibly less labour inputs? Some people see unbounded growth as naïve suggest that there are limits to growth. In my opinion, this confuses the physical limitations (say land) that may eventually dictates that growth will cease with the near term we all live in. And although these are great philosophical questions and worthy of debate, it is far from my competitive (or absolute) advantage to do this. So let me move back to solid ground.
With a natural interest in real growth, it is not surprising that economists have sought to model growth both theoretically and empirically. The results of this modelling have been mixed and many questions remain outstanding. Growth and growing income inequality spring to mind. While these academic debates spin along, the demand for forecasting real growth is unabated. The parallel to polling comes to mind. Everyone criticizes polls (especially me) but they are read, argued about and used by a number of folks. Forecasters are in the same boat!
Like our earlier work, most forecasters use quarter over quarter real growth. Producing a four quarter ahead forecast produces the next year’s outlook. Most forecasters also report a year over year growth rate forecast as well. For example, at the time of writing, the 2015Q3 was not yet released and it is common to see forecasts for the end of 2015Q4, the yearly forecast for 2015 and a 2016 forecast. Given the persistence observed in the quarterly data, one might indeed question the methodology used in these longer horizon forecasts. Occasionally these were updated so that more current information was used. But still 2017 is quite a ways off and are we simply just forecasting the average growth rates observed over the decade? No current information is actually tempering the 2017 annual forecast!
Quarterly real growth for Canada is a rather herky-jerky series (another way of saying that there is little persistence) which makes discussing trends in growth rates largely meaningless. If we just want to forecast what is demanded by policymakers, then we can leave this issue aside. But we think there is some value in pursuing the measurement question further and we shall briefly look at other possibilities.
Smoothing Growth
Changes in stock prices are also not persistent (if they were we could do the forecasts and be rich). Analysts have tried to extract “direction” from recent price movements by smoothing or averaging. Popular calculations are 50/200 day moving-averages. These slower moving objects create trends that can be analysed for breaks, cross-overs and other features used in technical analysis.
Similarly new uptake in jobless claims, monthly employment changes and other higher frequency data have measurement error, noise etc. and it is common to smooth them by averaging over some interval. This smoothing is viewed as extracting the “signal” from the noise and thus is helpful in interpreting current activity. Real growth may be a candidate for such smoothing and we explore this. Since forecasting is driven by demand and the demand is for quarterly real growth forecasts, we are not offering this as a substitute. Call it academic curiosity!
Smoothed Growth
A very simple moving average scheme is to smooth over the last 4 quarters as well as the current
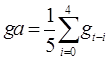
The smoothing parameter is constant (1/5) but we could down-weight more distant observations. The smoothing “slows” the series creating a much more persistent one ( has estimated 1st order autocorrelation of 0.9 vs. the real growth rate
  of 0.5). Comparing the two we see
has estimated 1st order autocorrelation of 0.9 vs. the real growth rate of 0.5). Comparing the two we see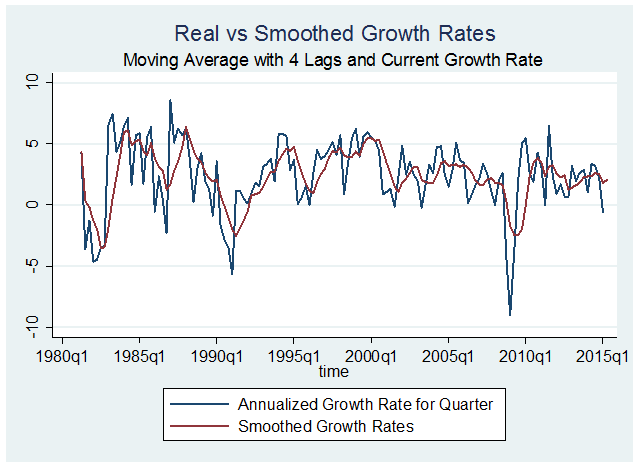
evidence of cycles with longer lasting peaks and troughs (albeit reduced in magnitude). While there is much to recommend to studying smoothed growth rates, they are not the ones widely implemented in academic real business cycles papers. They are also never forecasted.
Deviations from Real GDP Trend
Many trending series exhibit prolonged departures from the trend line. Such deviations from trend line can indicate upturns/downturns. We often see series graphed against trend lines in the press. In the United States there was a rather strange debate as to whether US real output was better characterized as I(1) (growth) or I(0) (trend stationary) with a break at the Great Depression (1929). Although this particular question is not of great empirical interest in itself, the idea that real output might be trend stationary cast some questions on the focus on growth rates.
Below we graph real GDP, its trend and deviations from growth (scale is on right). 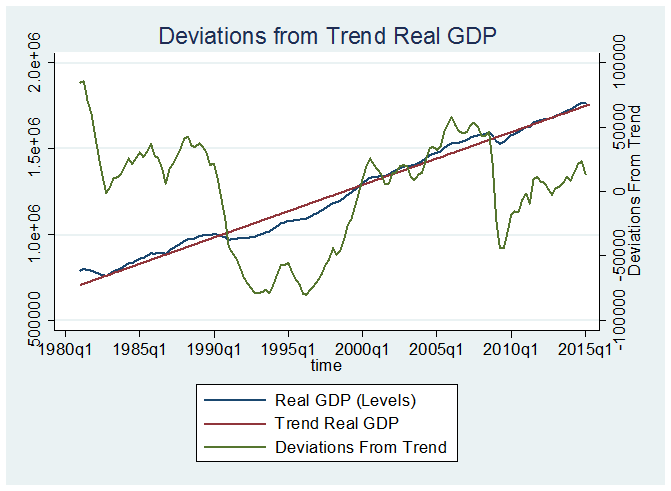
The 1980s are characterized by above trend growth, the 1990s below trend growth and the 2000s until crash of 2009 at trend. Recent data places us below trend. Roughly speaking this categorization accords with our perceptions of the level of economic activity over the last 30 plus years.
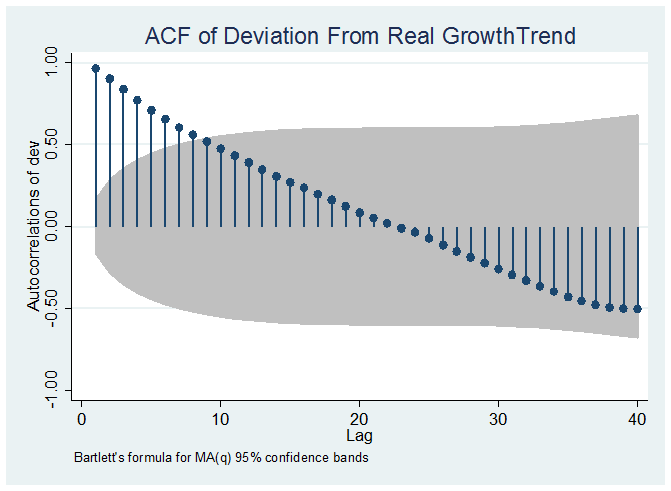
But the deviations are I(1) and therefore not stationary. The autocorrelation function (ACF) dies down very slowly with a first-order coefficient of 0.96. This makes deviations from trend not suitable for most empirical forecasting or theoretical analysis.
And that leads us to the most popular measure used by real business cycle researchers.
And that leads us to the most popular measure used by real business cycle researchers.
Studying Real Business Cycles: Hodrick-Prescott Filtering
The spikey behaviour in real growth rates is a common feature across most developed countries. It is not consistent with business cycle movements that we think are slow moving phenomena. The debate on what became the standard measure is mostly unsatisfying and I will spare you the gory details (for the real old folks in the crowd, see Cambridge controversy on measuring physical capital).
Real business cycle models seek to understand the ups and downs in the economy that we know exist but find difficult to measure. Good times and bad times typically arrive with some warning or in the language we have used, they have persistence. The theoretical models typically have real output and other real magnitudes changing slowly depending on the nature of the shocks.
Usually all shocks in theoretical models are stationary (I(0)) so that the resulting endogenous real variables are as well. How then to get an empirical construct analogous to the theory was a hot topic in the 80s. The guru of all things real business cycle stem from Professor Ed Prescott who came up with what is known as the Hodrick-Prescott filter (HP). This filter took any nonstationary series like real output in levels and created a new series that was stationary. The filtered series “felt” right in that it mimicked the perceptions of the slower moving (unobservable) business cycle. The filter is built into most economic software (like Stata which I use)
Let’s have a look at what it does for Canadian real output compared to our growth rate calculation:
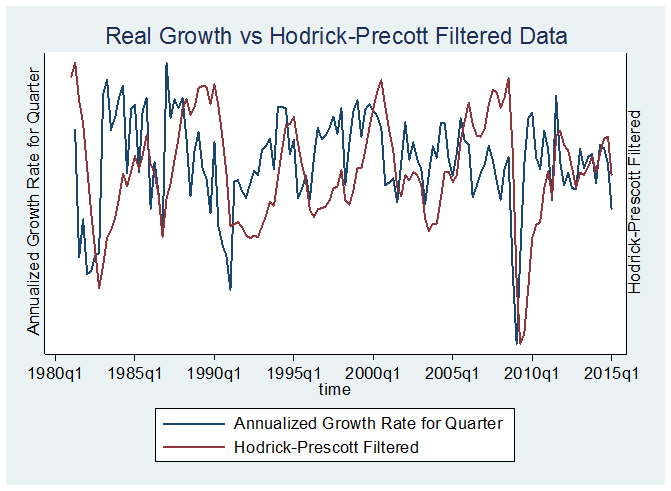
The Hodrick-Prescott filtered data is a much slower moving series than real growth rates (a first order autocorrelation of 0.9 vs. 0.5) but is nevertheless stationary.
Since no professional forecaster ever predicts HP filtered data we will leave this concept and this debate.
Monday, 4 January 2016
Happy New Year to my Readers (I imagine there is someone out there).
On this first business day of 2016 and where the market kind of tanked worldwide, I thought I should bring in the latest forecasts for 2015Q4. They are not very hopeful but those folks who do longer run forecasts tell us 2016 will be better. We will see. This graph is reproduced in my header but is also below. My own Canadian real GDP growth forecast at this point is -0.85%. The high is Scotiabank with a slim 1.6% growth (all annual rates). The rest fit in between.
In the coming weeks I will let you folks know the current model I am using (involves incorporating monthly real GDP as they become available).
In the next blog, I want to discuss what to forecast. Why growth? Why not deviations of trend or some other construct. Until then thanks for dropping by! And now the promised graph
On this first business day of 2016 and where the market kind of tanked worldwide, I thought I should bring in the latest forecasts for 2015Q4. They are not very hopeful but those folks who do longer run forecasts tell us 2016 will be better. We will see. This graph is reproduced in my header but is also below. My own Canadian real GDP growth forecast at this point is -0.85%. The high is Scotiabank with a slim 1.6% growth (all annual rates). The rest fit in between.
In the coming weeks I will let you folks know the current model I am using (involves incorporating monthly real GDP as they become available).
In the next blog, I want to discuss what to forecast. Why growth? Why not deviations of trend or some other construct. Until then thanks for dropping by! And now the promised graph

Friday, 18 December 2015
Monday, 7 December 2015
Tuesday, 1 December 2015
Hi
Just a short blog today to give the first results of my forecasting project. I predicted a 2.8% real GDP growth at annual rates and the actual was 2.3%. RBC, Scotia and TD all had 2.5% and were the closest among the Bank forecasts. Trevor Tombe (University of Calgary) tossed out a 1.4% last night and claimed a victory over me under the Price Is Right Rules (cannot go over). Stephen Gordon (Laval) was spot on with 2.3% done yesterday morning. Of course if you just had used the unconditional estimate (the sample mean) of 2.4% you would also have been a star!
In general, I think the forecasts all were reasonably close. The surprising thing in my view today was the monthly release of the September number of -1.98% at annual rates for September 2015. This was not great and certainly dampened the quarterly number.
Just to get the ball rolling for 2015Q4, my initial forecast is -0.5%. Let the next recession talk begin.
Dec 2: Did anyone else notice that the entire history or real GDP growth at 2007 prices has been changed from 1981Q1 onward . Not big changes but if you are in the forecasting business make them!
See http://www.statcan.gc.ca/eng/nea/dates/index#niea
Just a short blog today to give the first results of my forecasting project. I predicted a 2.8% real GDP growth at annual rates and the actual was 2.3%. RBC, Scotia and TD all had 2.5% and were the closest among the Bank forecasts. Trevor Tombe (University of Calgary) tossed out a 1.4% last night and claimed a victory over me under the Price Is Right Rules (cannot go over). Stephen Gordon (Laval) was spot on with 2.3% done yesterday morning. Of course if you just had used the unconditional estimate (the sample mean) of 2.4% you would also have been a star!
In general, I think the forecasts all were reasonably close. The surprising thing in my view today was the monthly release of the September number of -1.98% at annual rates for September 2015. This was not great and certainly dampened the quarterly number.
Just to get the ball rolling for 2015Q4, my initial forecast is -0.5%. Let the next recession talk begin.
Dec 2: Did anyone else notice that the entire history or real GDP growth at 2007 prices has been changed from 1981Q1 onward . Not big changes but if you are in the forecasting business make them!
See http://www.statcan.gc.ca/eng/nea/dates/index#niea
| Release date | Reference period |
|---|---|
| March 3, 2015 | First quarter 2014 to fourth quarter 2014 |
| May 29, 2015 | First quarter 2014 to first quarter 2015 |
| September 1, 2015 | First quarter 2015 to second quarter 2015 |
| December 1, 2015 | First quarter 1981 to third quarter 2015 |
| March 1, 2016 | First quarter 2015 to fourth quarter 2015 |
| May 31, 2016 | First quarter 2015 to first quarter 2016 |
| August 31, 2016 | First quarter 2016 to second quarter 2016 |
| November 30, 2016 | First quarter 2016 to third quarter 2016 |
| March 2, 2017 | First quarter 2016 to fourth quarter 2016 |
| Release date | Refer |
|---|
Tuesday, 24 November 2015
Tuesday, 10 November 2015
Friday, 30 October 2015
Monday, 26 October 2015
Friday, 16 October 2015
Forecasting in Canada
Introduction
Welcome to my new blog on economic forecasting. The goal is
to discuss, compare and even evaluate alternative methods and tools for
forecasting economic activity in Canada. I hope others involved in the business
of forecasting will share their work, opinions and so on in this forum.
Hopefully, we can understand the interaction of forecasting theory and
practical forecasting. The two sometimes agree but as in any application there
are tensions and confusion.
A word of apology or explanation, whatever seems to fit? I
have been teaching times series in The Department of Economics at Queen’s
University for more than 25 years. As such, I have become somewhat
institutionalized as an instructor. However, if the tone comes off that way in
this blog, it’s not intentional. This is meant to be a learning exercise for
me, especially me. It’s easier to teach theory I have discovered, but actual
confrontation with data and forecasting has been edifying.
We will commence with forecasting real growth but as time
goes along we will likely branch out into other important variables like
employment change, inflation and so on. Real growth seems the most sensible
place to start since it is the mostly widely forecasted variable in the Canadian
scene. In the U.S. the change in employment produced monthly by the Bureau of
Labor Statistics would have that honour.
We also invite other professional forecasters to participate
in this challenge as well. What we have in mind in this regard, is something
akin to ThreeHundredEight (http://www.threehundredeight.com/)
where we keep track of real growth predictions by various members of the
Canadian forecasting community. These forecasts will just be a record and time
of forecast without any detail of the model(s) or expertise behind them.
However, our pledge is to describe exactly how our forecasts are done so those that
the following at home can replicate them.
This web page is meant for the reader to get in real time
the most recent information regarding the Canadian economy’s growth forecast.
We are not going to be running a report card or accuracy tournaments. Instead
we want a forum by which various forecasters and users of these can interact
and discuss the different predictions and there implications for the Canadian
economy.
There are at least two choices to be made regarding real
growth
1.
Frequency
2.
Horizon
We think that there is widespread agreement among
forecasters that quarterly growth rates (quarter over quarter) are most useful.
I am going to start there with just a one –period ahead forecast. Our real growth rates are taken from Table 380
0064 and are seasonally adjusted at annual rates in chained 2007 dollars. Its
label is Gross Domestic Product at Market Prices (available at Statistics
Canada http://www.statcan.gc.ca/). This table is
updated at regular intervals and is subject to revision.
Just to get this rolling I have taken from the Internet, real
growth forecasts for 2015Q3 of the Canadian Banks along with 2 of mine
(labelled AWG). In blue are the most recent forecasts identified by the Banks
and myself with a time when the forecasts were (or I found them). I update my
forecasts as you will see and I will explain that at a later date. Older
forecasters are found below the blue one.
In this figure I also provide the historical average mean
growth rate and as time goes on the actual first release real growth will be
added along with the subsequent revisions.

Subscribe to:
Posts (Atom)